The Insights page provides you with a number of charts that assist you in tracking the performance and effectiveness of tests and batches that teams execute on your account. Reviewing the charts allows managers to identify ongoing trends or risks. The scope of data that you can view is role based. Account admins can view data at the account and team level. Users that do not have admin rights can only view data that relates to the teams for which they are a member.
You generate the charts by specifying the value for two settings, the Scope and the Date Range. The Scope determines if data is taken with respect to the entire account or one or more teams that are assigned to your account, while the Date Range sets the time frame boundaries for which the Insights data is collected.
You access this page by using the page navigator The Page navigator is a control at the top of the Test manager window that is used to switch between the main pages of the Test manager. It also displays the name of the current page. Insights menu entry.
The main tasks that you perform on the Insights page are:
- Setting the scope for which data is displayed, the account or team.
- Setting the date range over which data is displayed.
The Insights page layout
The Insights page is divided into several sections:
- The Insights toolbar.
- The Tests Analytics tab.
- The Batch Statistics tab.
- The .
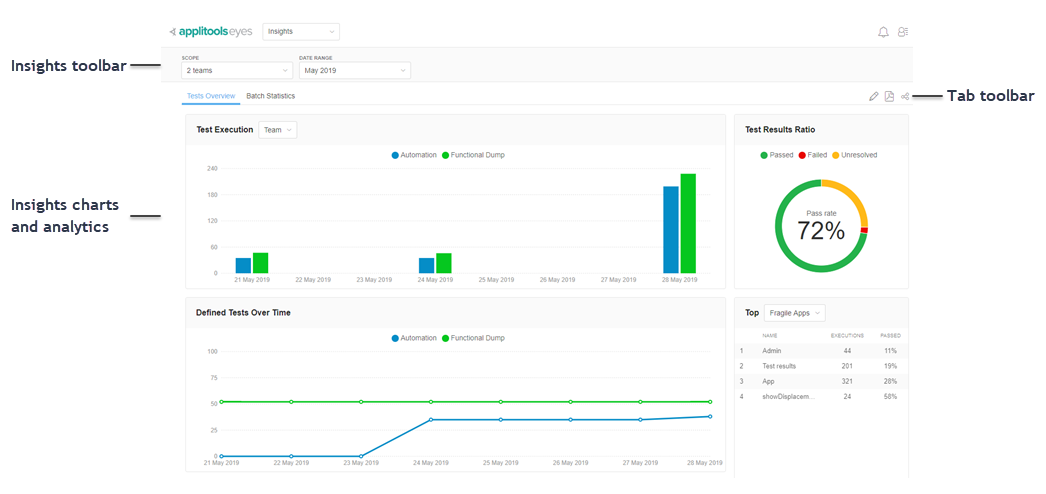
- The Insights toolbar
- Use the toolbar Scope selector to select the account or teams for which information is displayed and the Date Range feature to set the time frame used for extracting information from the database.
- The Test Analytics tab
- Displays a set of charts that provide an at-a-glance view of all executed tests and generated test statistics for the account or for a selection of teams over a selected time frame.
- The Batch Statistics tab
- Displays a list of Batches that were executed over the selected time frame. Each row in the list displays a separate batch and basic batch run and status information such as Last run, Pass, Fail, Unresolved and Total runs. Clicking a row, expands the row to display a set of charts and analytics for that Batch.
- The
- Contains tools for arranging the display or extracting and sharing information presented on the tab. One or more of the following tools are available depending on the currently active tab:
- Arrange display: Click the Arrange display icon and the page changes to allow you to reposition the charts. Drag and Drop the charts into a new position and then click the Arrange display icon again to return to the regular display.
-
 Print PDF: Click the PDF icon to capture the screen, ready to save in PDF format.
 - Share link: Click the Share link icon to copy a link for the current page to the clipboard. From that point you can share the link.
Setting the Scope
Use the Scope selector to select the account or teams for which information is displayed on the tab. You can choose between displaying reports and charts that reflect test execution for the entire account or for a selection of one or more teams assigned to the account.
- Click the Scope drop-down list in the Insights toolbar.
- Click the Account option in the list to set the scope to the account.
- Click the Team option in the list and then select one or more team checkboxes to set the scope to the selected teams.
- Click Apply to save your selection and update the charts and data presented on the Test Analytics tab.
Setting the Date Range
Applying a date range to the Insights page affects the charts and analytics that the Insights page displays in two ways. First, the period of time over which you sample the tests to produce the charts is increased or decreased to match the date range. Second, based on period of time that you select, Eyes adjusts the number of segments that it displays in the resulting charts so as to clearly present the data. The exact number of time segments that are used varies according to type of information presented in a specific chart.
You can select a date range from several preset date ranges or set a custom date range.
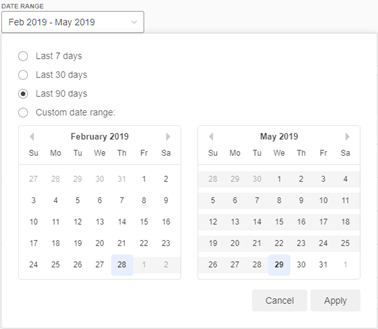
- Last 7 days
- Last 30 days
- Lost 90 days
When you select a Custom date range Eyes opens a standard date picker calendar from which you can select a Start date and End date.
- Click the Date Range drop-down list in the Insights toolbar.
- Click one of the preset date range options to use one of the commonly used date ranges.
- Click Custom date range to use the calendar to set the date range.
- Select a date from the calendar on the left for the start date and select a date from the calendar on the right for the end date.
- Click Apply to update the data on the charts to match your selections.